John was happy. He’d just turned in a commission and he was enjoying a relaxing evening. Hours upon hours of development, optimization, testing, changes and approvals were left behind.
And just as he was contemplating picking up a nice cold beer, his phone rang.
“Only half the viewers could connect to the stream!” — said the voice on the other side of the line.
With a resigned sigh, John opened up his laptop and started pouring through logs.
Unfortunately, in all of those many tests, he never considered that a big number of viewers would mean great strains for the server infrastructure and the network itself.
As it happens, John is not alone in his plights. Many users reach out to tech support with questions like these:
“What kind of server do I need for 1000 viewers?”
“My server is solid, but only 250 viewers can connect simultaneously, the rest either can’t join, or get stuck with terrible video quality”
Such questions have one inquiry in common: How does one choose a correct server?
Previously we’d already touched on the topic of choosing a server based on the number of subscribers. Here’s the gist:
1. When choosing a server for streaming—with or without balancing—you need to take into the account the load profiles:
- basic streaming;
- streaming with transcoding;
- stream mixing.
2. Streams with transcoding and mixing place greater loads on the CPU and RAM, compared to basic streams. The load on the server CPU shouldn’t exceed 80%. If that’s the case, all viewers will receive the video of decent quality.
3. In practice, it is often the case that the stream quality depends not on the server specs, but on the network capacity.
Here’s a quick reference on how to calculate the number of streams based on the network capacity:
One 480p stream takes up about 0.5 – 1 Mbps of traffic. WebRTC streams have a variable bitrate, so let’s assume it’s going to take 1 Mbps. Thus, 1000 streams equals 1000 Mbps.
4. The number of viewers and the stream quality partially depend on the way the server is configured — the number of media ports and the ZGC usage.
In this article, we’ll take a look at how to run a server stress test and we’ll see whether all the aforementioned points hold true.
Testing plan
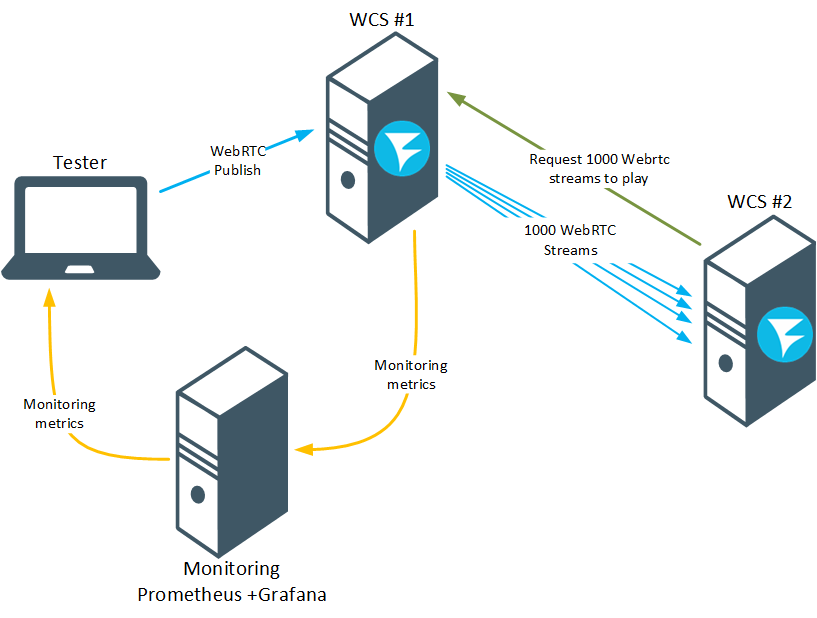
- Publish a stream from a camera on a WCS server #1 following the instructions from a previous example, “Two Way Streaming”
- Using the Console web app start a stress test, where the WCS server #2 will imitate 1000 users trying to connect to WCS #1.
- Using the data from the Prometheus monitoring system, check the server load and the number of outgoing WebRTC streams.
- If the server is handling the requested number of streams, manually check the stream quality degradation (if there is any).
The test shall be considered successful if 1000 viewers could connect to WCS#1 with no visible quality degradation.
Preparing for testing
For this test you’ll need
- two WCS servers;
- standard streaming setup described in Two-Way Streaming;
- Console web app for testing;
- Google Chrome browser and Allow-Control-Allow-Origin extension for working with Console.
If you don’t have Access-Control-Allow-Origin installed, do so and run it:
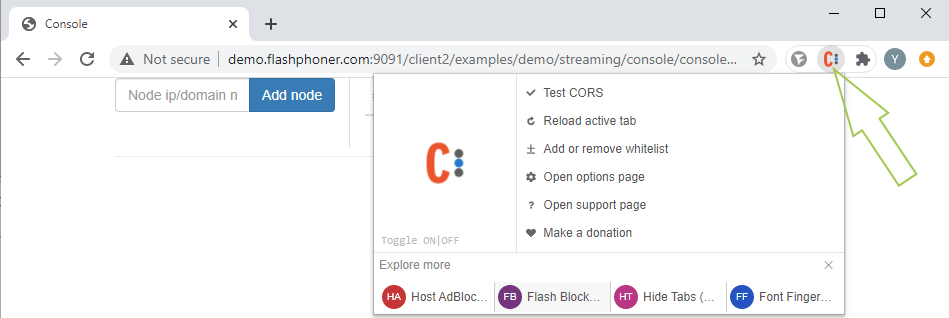
We assume your WCS is already installed and configured. If not, follow this guide.
For the test to be successful and for the results to be usable, you need to go through the following preliminary steps.
1. Extend the media port range for WebRTC connections in the following file: flashphoner.properties
media_port_from = 20001
media_port_to = 40000
Make sure the range doesn’t overlap with other ports that are used by the server and with Linux ephemeral port range (you can change it, if necessary)
2. In that same file, specify the parameter that increases the duration of the test and the parameter that will display on the statistics page the data regarding the network load:
wcs_activity_timer_timeout=86400000
global_bandwidth_check_enabled=true
3. With a large number of subscribers per stream (100 or more) and an sufficiently powerful server processor and communication channel, the stream playback quality can drop, which manifests in FPS drops and freezes. To avoid this, it is recommended to enable stream distribution via CPU threads, using a special setting in flashphoner.properties:
streaming_distributor_subgroup_enabled=true
In this case, users’ audio and video sessions will be distributed into groups.
The maximum number of video sessions per group is set by the following setting:
streaming_distributor_subgroup_size=50
The maximum number of audio sessions per group is set by the following setting:
streaming_distributor_audio_subgroup_size=500
The packet queue size per group and the maximum wait time for a frame to be sent (in milliseconds) are set by the following settings:
streaming_distributor_subgroup_queue_size=300
streaming_distributor_subgroup_queue_max_waiting_time=5000
streaming_distributor_audio_subgroup_queue_size=300
streaming_distributor_audio_subgroup_queue_max_waiting_time=5000
4. Enable hardware acceleration of WebRTC traffic encryption. By default, BouncyCastle library is used for encryption of WebRTC traffic, but if your server’s processor supports AES instructions, it is worth switching to Java Cryptography Extension using settings from flashphoner.properties
webrtc_aes_crypto_provider=JCE
and enable AES support in Java Virtual Machine settings, which can be found in wcs-core.properties
-server
-XX:+UnlockDiagnosticVMOptions
-XX:+UseAES
-XX:+UseAESIntrinsics
This way, due to hardware acceleration, the encryption performance will be increased 1.8-2-fold, which may serve to unload the server processor.
You can check whether your server processor supports the AES instructions with the following command:
lscpu | grep -o aes
5. Enable ZGC in JavaVM. The recommended JDK versions (which have been proven to work well with WCS) are 12 and 14 (Here’s the installation guide)
To configure ZGC, do the following:
- In wcs-core.properties comment out the following lines:
-XX:+UseConcMarkSweepGC
-XX:+UseCMSInitiatingOccupancyOnly
-XX:CMSInitiatingOccupancyFraction=70
-XX:+PrintGCDateStamps
-XX:+PrintGCDetails
- Adjust the logs settings
-Xlog:gc*:/usr/local/FlashphonerWebCallServer/logs/gc-core.log
-XX:ErrorFile=/usr/local/FlashphonerWebCallServer/logs/error%p.log
– Make the heap size no less than half of the server’s physical memory
### JVM OPTIONS ###
-Xmx16g
-Xms16g
- Enable ZGC
# ZGC
-XX:+UnlockExperimentalVMOptions -XX:+UseZGC -XX:+UseLargePages -XX:ZPath=/hugepages
- Configure the memory pages. Make sure to calculate the number of pages fit for the selected heap size:
(1,125*heap_size*1024)/2. Для -Xmx16g это число (1,125*16*1024)/2=9216
mkdir /hugepages
echo "echo 9216 >/sys/kernel/mm/hugepages/hugepages-2048kB/nr_hugepages" >>/etc/rc.local
echo "mount -t hugetlbfs -o uid=0 nodev /hugepages" >>/etc/rc.local
chmod +x /etc/rc.d/rc.local
systemctl enable rc-local.service
systemctl restart rc-local.service
Once ZGC is configured, you’ll need to reload WCS.
6. To make server monitoring easy, we suggest deploying the Prometheus+Grafana monitoring system.
We’ll be monitoring the following indicators:
- CPU load:
node_load1
node_load5
node_load15
- Physical memory usage for Java:
core_stats{instance="your.WCS.server.nam..8081", job="flashphoner", param="core_java_freePhysicalMemorySize"}
core_stats{instance="your.WCS.server.nam..8081", job="flashphoner", param="core_java_totalPhysicalMemorySize"}
- Pauses in ZGC operations:
custom_stats{instance="your.WCS.server.nam..8081", job="flashphoner", param="gc_pause"}
- Network capacity:
network_stats
- Number of streams. For the stress tests, we’ll count the outgoing WebRTC connections:
streams_stats{instance="your.WCS.server.nam..8081", job="flashphoner", param="streams_webrtc_out"}
- Number and percentage of degraded streams:
degraded_streams_stats{instance="your.WCS.server.nam..8081", job="flashphoner", param="degraded_streams"}
degraded_streams_stats{instance="your.WCS.server.nam..8081", job="flashphoner", param="degraded_streams_percent"}
Test #1 – weak servers
For our first test, we’ll use two servers with the following specs:
- 1x Intel Atom C2550 @ 2.4Ghz (4 cores, 4 threads);
- 8GB RAM;
- 2x 1Gbps
The channel’s nominal capacity is 2x 1Gbps. Let’s see if it’s true.
You can measure network performance using the iperf tool. It supports all the common operating systems: Windows, MacOS, Ubuntu/Debian, CentOS. In its server mode, iperf can be installed along with WCS, which makes it possible to test the channel from one end to the other, from the publisher to the viewer.
Launch iperf in server mode:
iperf3 -s -p 5201
where:
5201 – the port to which iperf expects the clients will attempt to connect.
Launch iperf in client mode to test sending data from client to server via TCP:
iperf3 -c test.flashphoner.com -p 5201
where:
test.flashphoner.com – WCS server;
5201 – port for iperf in server mode.
Install and run iperf in server mode on the server #1:

Install and run iperf in client mode on server #2 and receive data on the network performance:
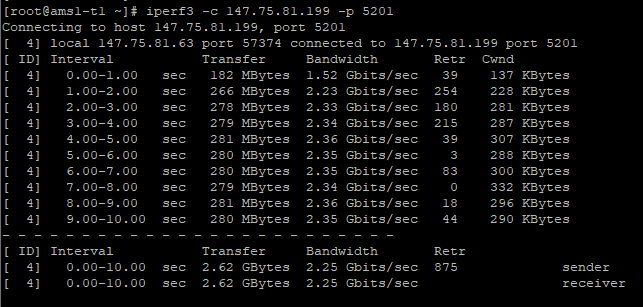
We see that the average network throughput between the publisher (server #1) and the viewer (server #2) is 2.25 Gbps, which means it can, theoretically, support 2000 viewers.
Let’s test this out.
Start the stress test.
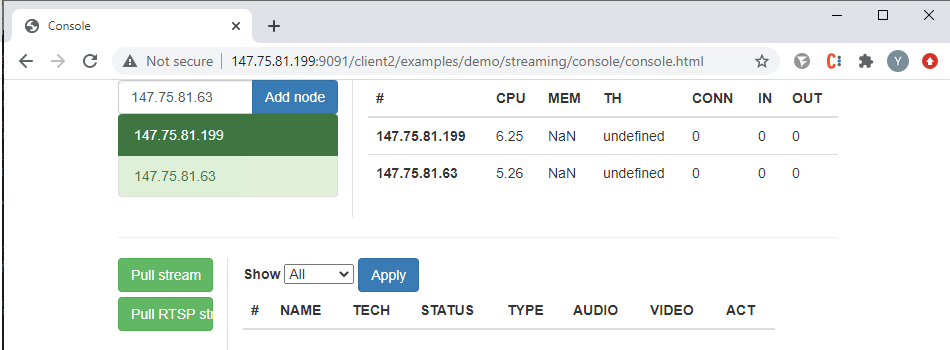
On server #1, open the Console app through HTTP http://your.WCS.server.name:9091/client2/examples/demo/streaming/console/console.html
Specify the domain name or IP address of the server #1 and click the button titled “Add node”. This shall be our test server, the source of the streams. Following the same steps, connect the server #2, which shall be imitating the viewers and capturing the streams.
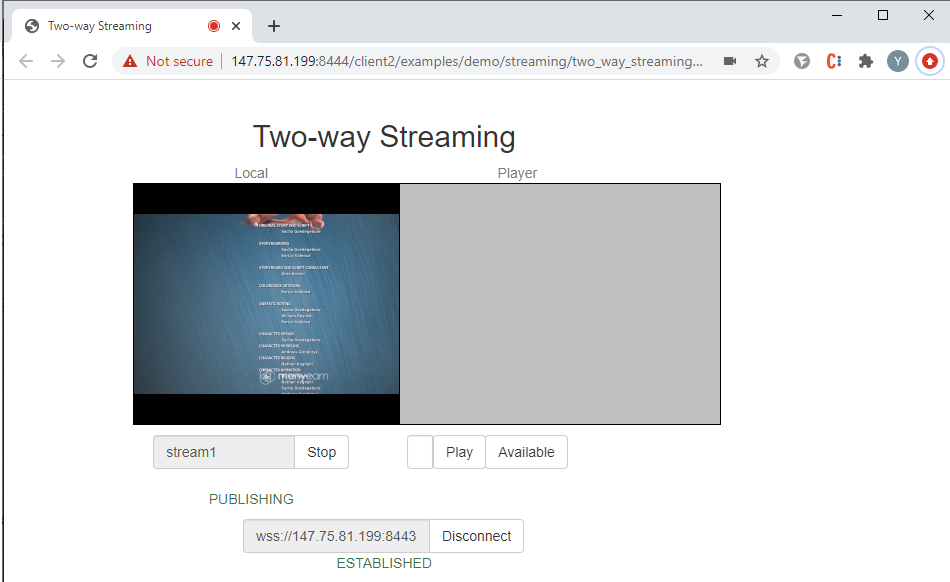
For server #1, start streaming the webcam feed following the guide in the Two-way Streaming article. Any stream name will do.
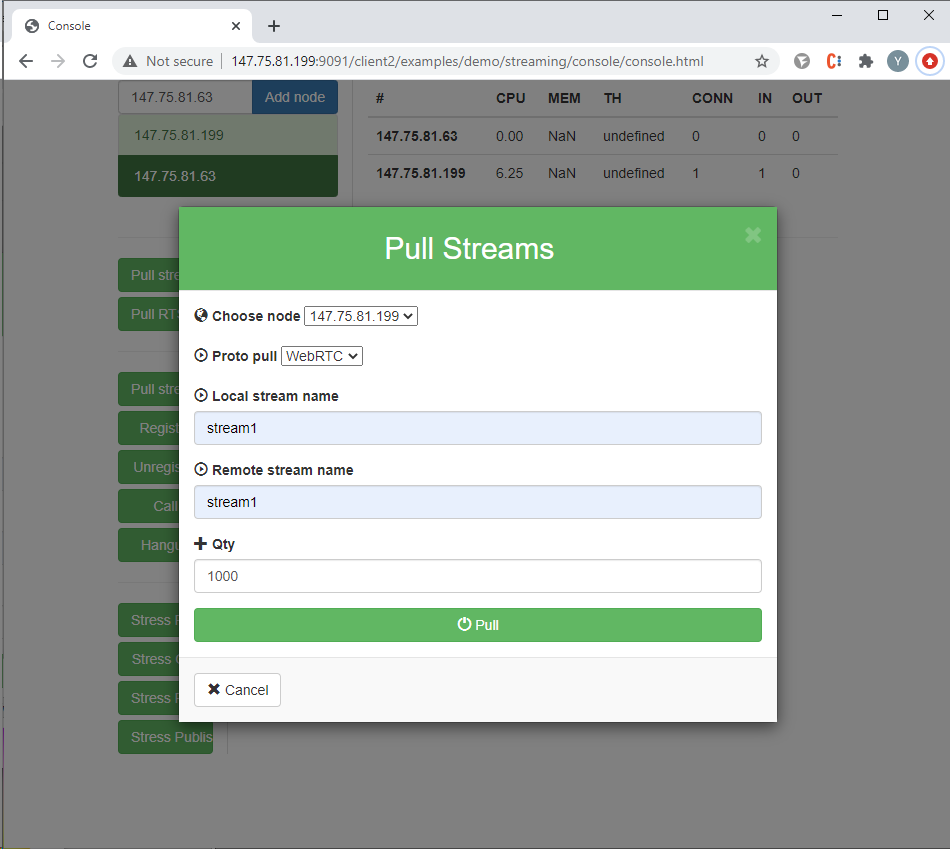
In the Console app, select server #2, click “Pull streams”, and enter the following test parameters:
- Choose node – pick server #1;
- Local stream name, Remote stream name – specify the name of the published stream (server #1);
- Qty – specify the number of viewers (for this test — 1000)
Click “Pull”:
During the test, we will monitor the situation using graphs provided by Grafana:
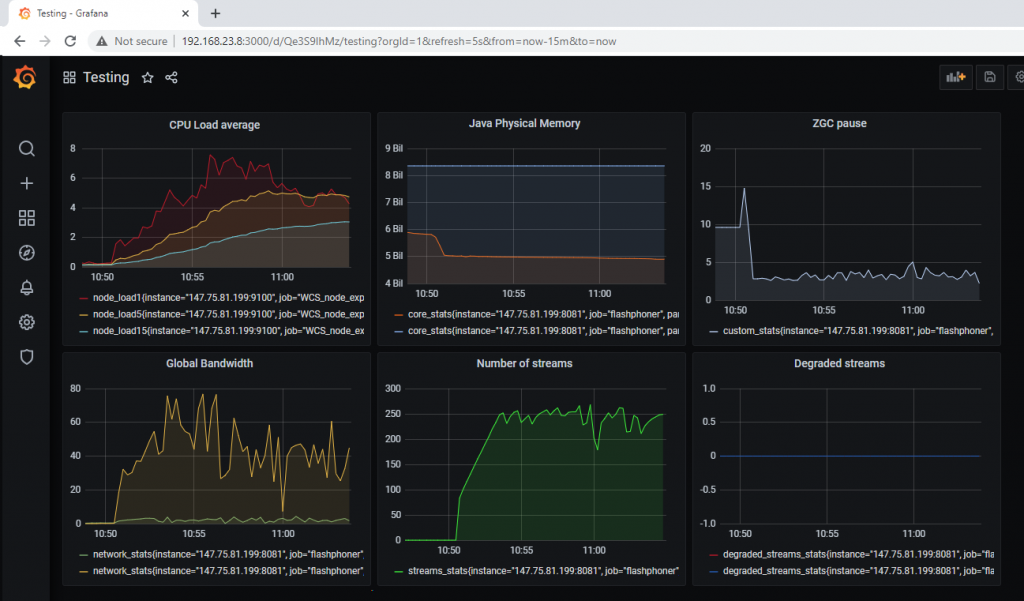
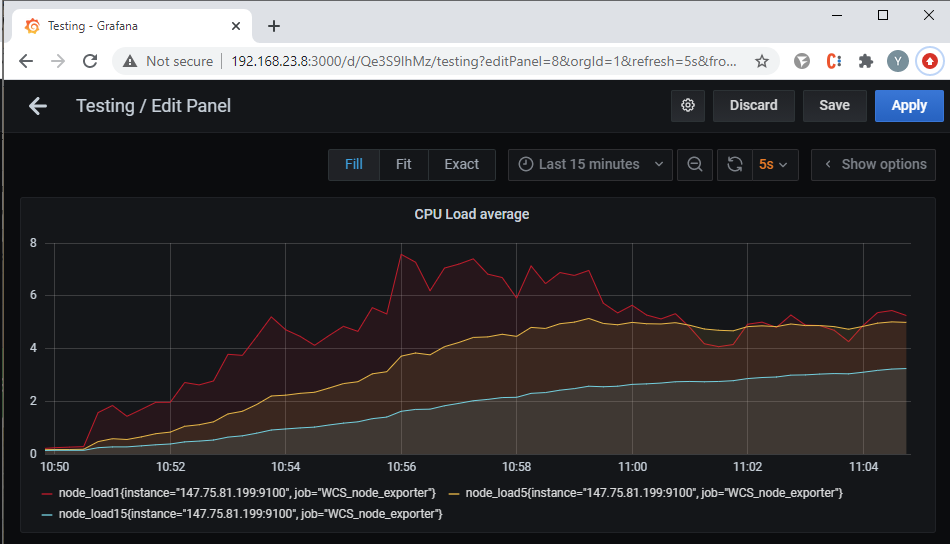
As you can see, the test increased the load on the server CPU. The Load Average of over 5 for a 4-core processor means it’s under a 100% load:
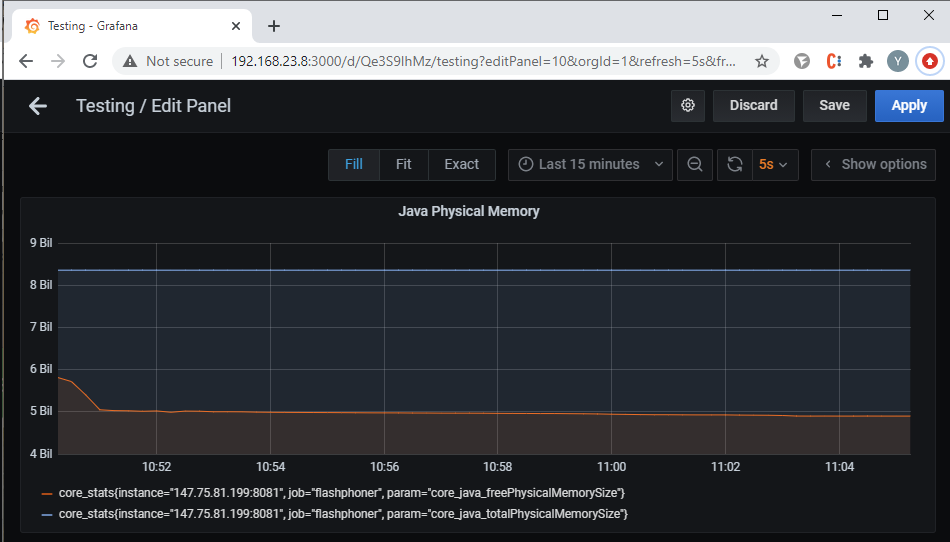
The available RAM size has decreased:
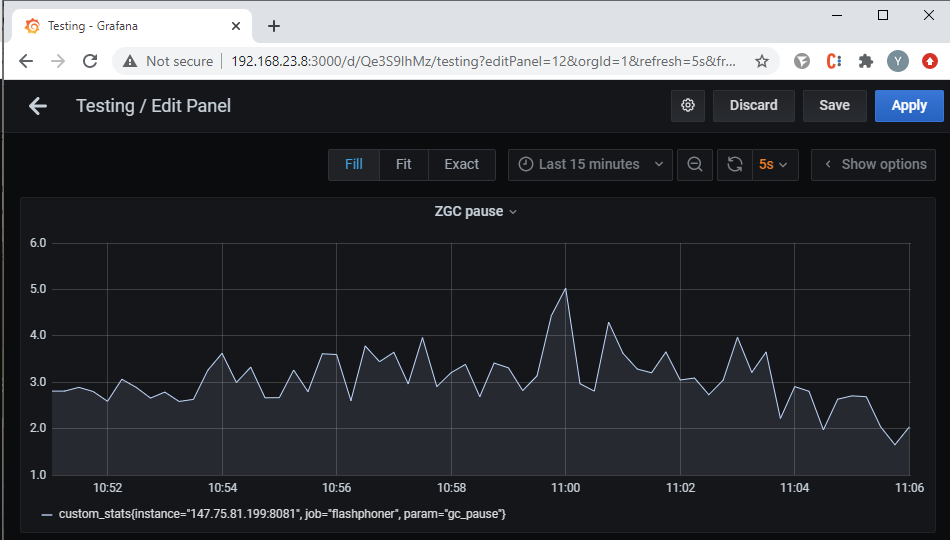
ZGC pauses lasted up to 5 ms, which is acceptable:
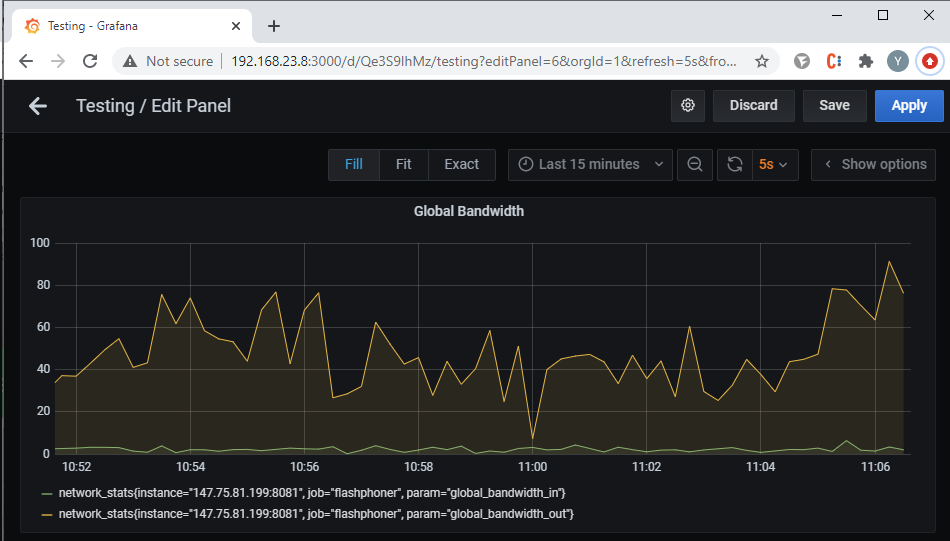
Graph of the channel bandwidth capacity. Here we see that the majority of the traffic is taken by the outgoing streams. The throughput never exceeded 100 Mbps (less than 5% of the nominal bandwidth, which we successfully tested with iperf ):
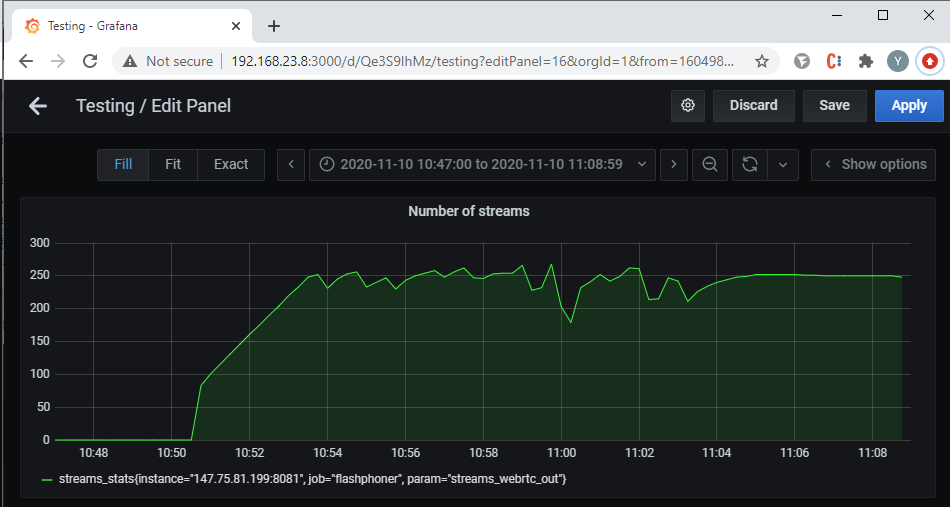
The number of the outgoing streams. As you can see, the test was almost a complete failure. We didn’t manage to service more than 260 users, and our target level was 1000.
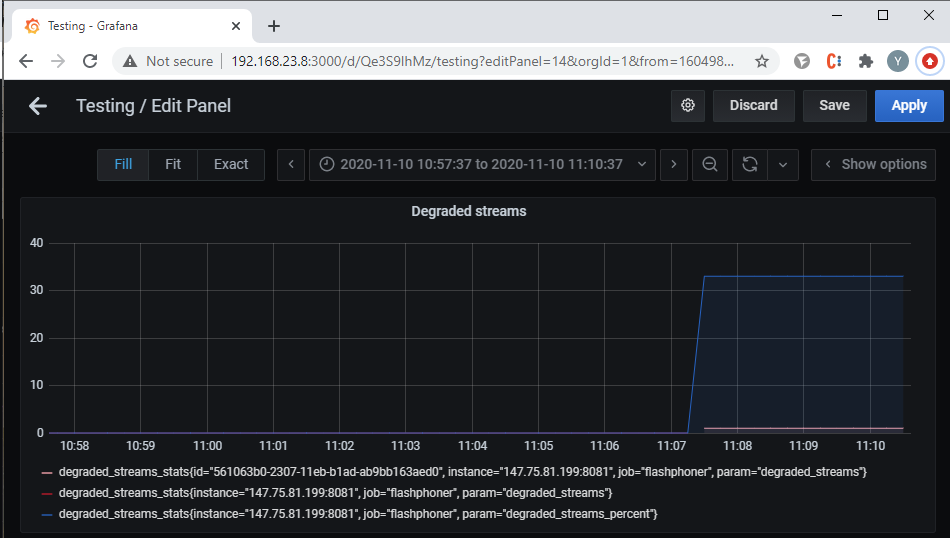
The degraded streams. As we got closer to the end of the stream, quality degradation started appearing. This makes sense, since the Load Average of over 5 on a 4-core processor means it’s 100% loaded and under such conditions stream degradation is inevitable:
The conclusion is simple:
As tempting as it may be to save money on hardware, weak servers and weak virtual instances can’t handle serious loads needed for high-quality production. Although, if your goals don’t require streaming for 1000 viewers, it might be a viable option.
For instance, using an “underpowered” server you can:
- set up a simple video surveillance system — distribute feed from an IP camera to a small number of subscribers via WebRTC;
- set up a system for webinar hosting for a small company;
- stream audio only (audio streams are less demanding).
Now let’s fire up more powerful servers and see if we can serve 1000 viewers.
Test #2 – powerful servers
For test #2 we’ll use two servers with the following specs:
- 2x Intel(R) Xeon(R) Silver 4214 CPU @ 2.20GHz ( 24 cores, 48 threads in total);
- 192GB RAM;
- 2x 10Gbps
As before, test the channel bandwidth with iperf:
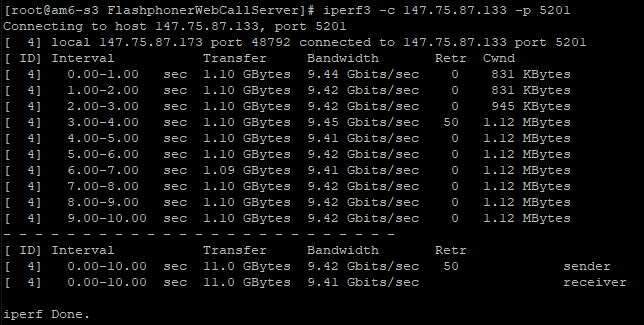
In this case, the bandwidth of the channel between the publisher (server #1) and the viewer (server #2) is 9.42 Gbps, which equals 9000 potential viewers.
Start the stress test as before using the Console web app.
Monitor the situation using graphs provided by Grafana:
Let’s take a closer look at the graphs.
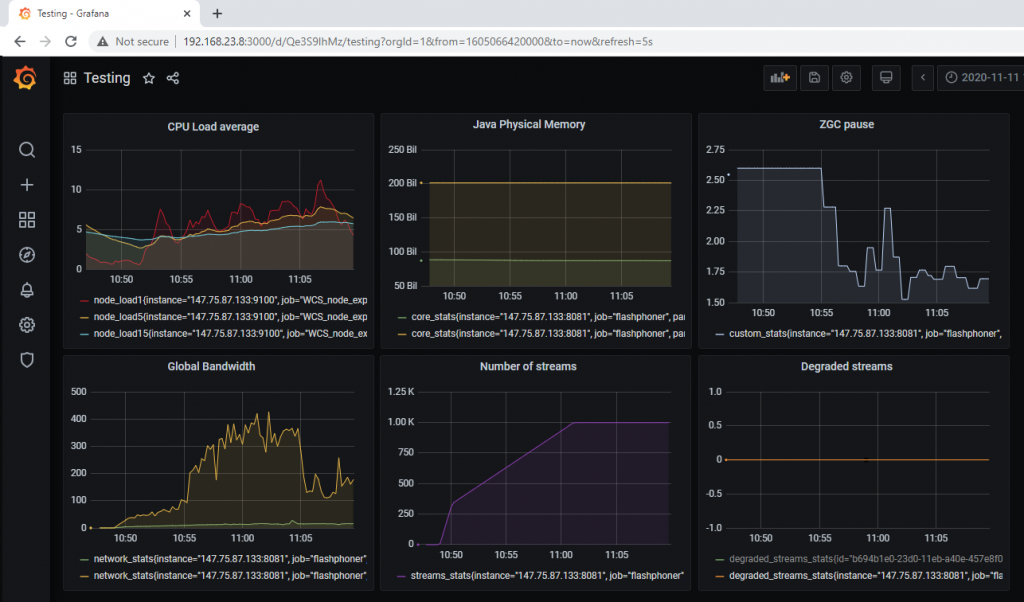
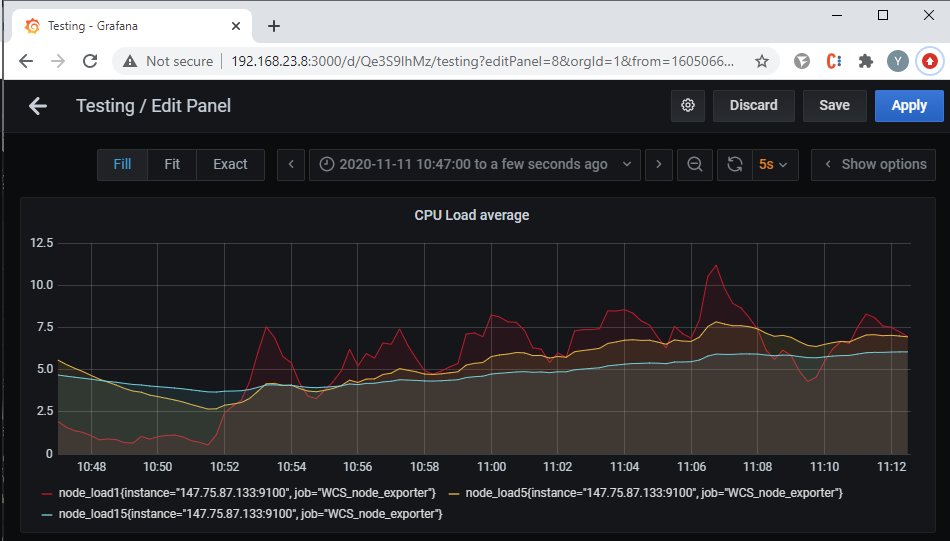
Predictably, the stress test increased the CPU load, but for the 48 threads the peak Load Average of 11 is not indicative of high loads. The server processor is clearly loaded, but it’s far from reaching full capacity:
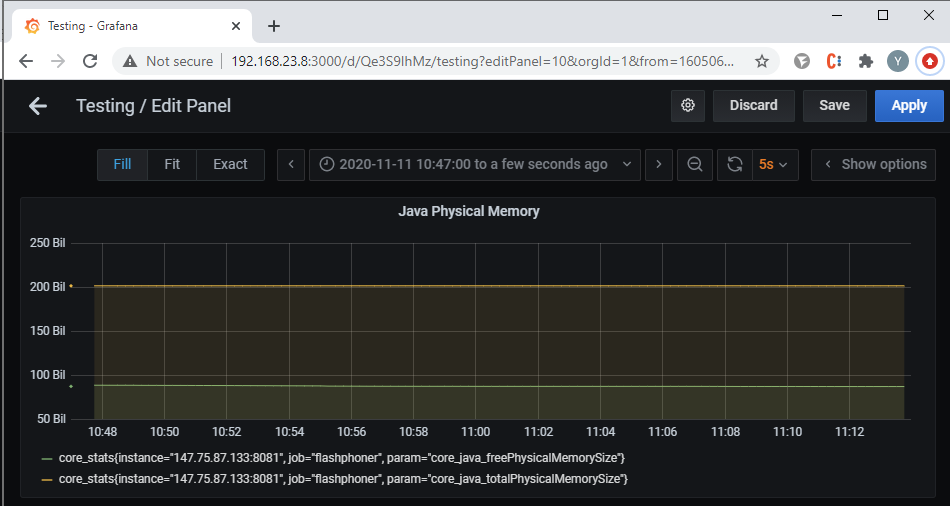
The available RAM size didn’t undergo significant changes:
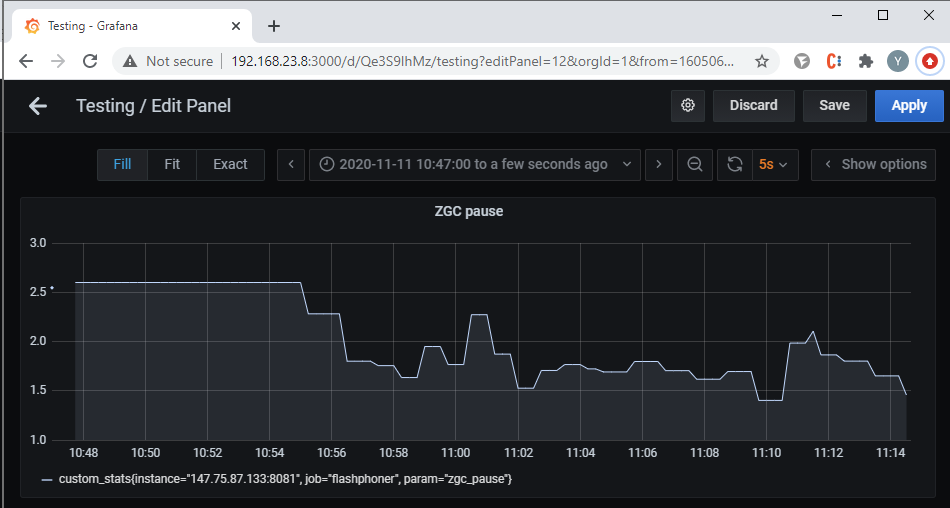
ZGC pauses reached 2.5 ms, which is acceptable:
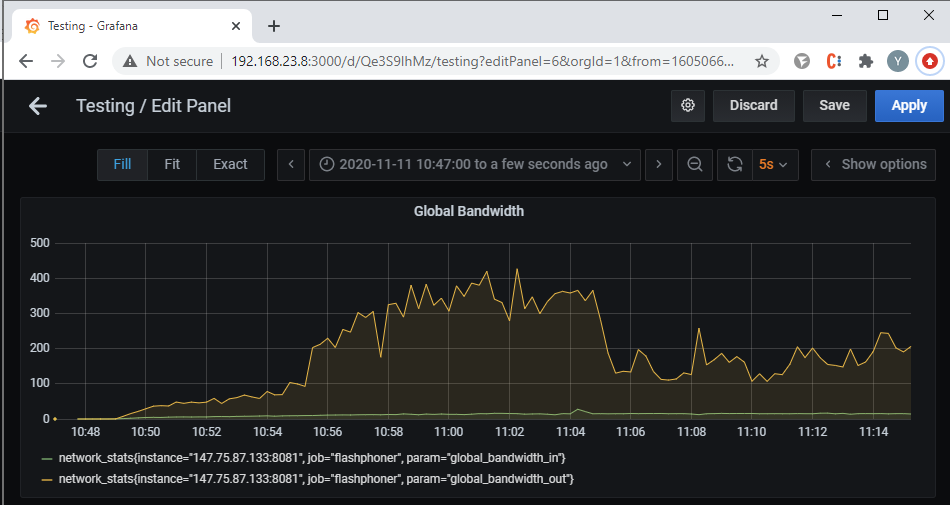
The graph of the network channel bandwidth. Here, we see that the outgoing streams take up the majority of the traffic. The throughput never went beyond 500 Mbps (around 5% of the nominal bandwidth, which we successfully tested with iperf ):
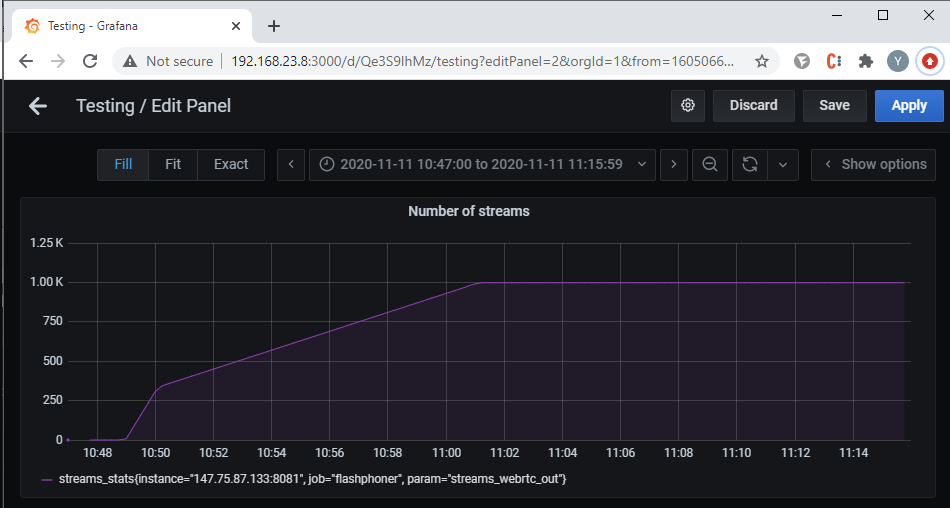
The number of outgoing WebRTC streams. The test of the big servers was successful. We managed to serve 1000 viewers.
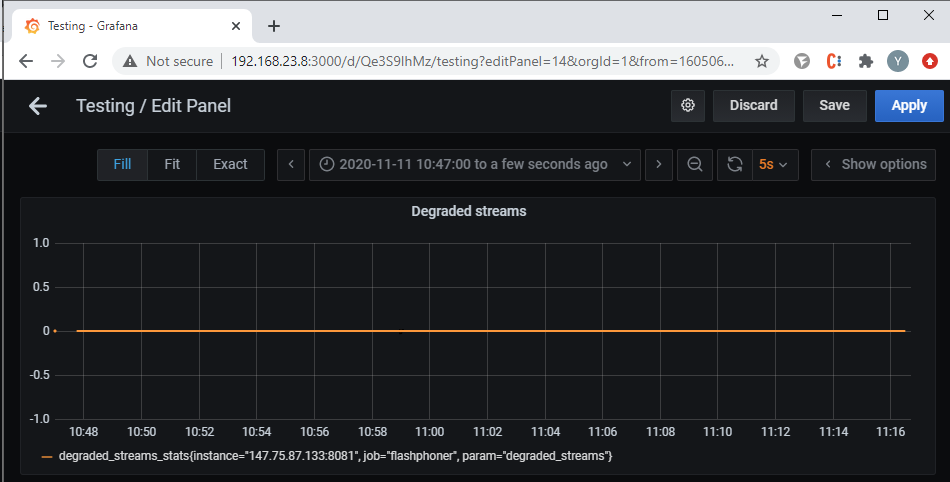
Degraded streams. The server handled the stress well, and no degraded streams occurred during the test:
To see if the test was a success you will need to connect to the server during the test and watch the stream like one of the subscribers which are being simulated.
On a test server, open a player and start a stream. It should have no quality drops – no stuttering, freezes, or artifacts:
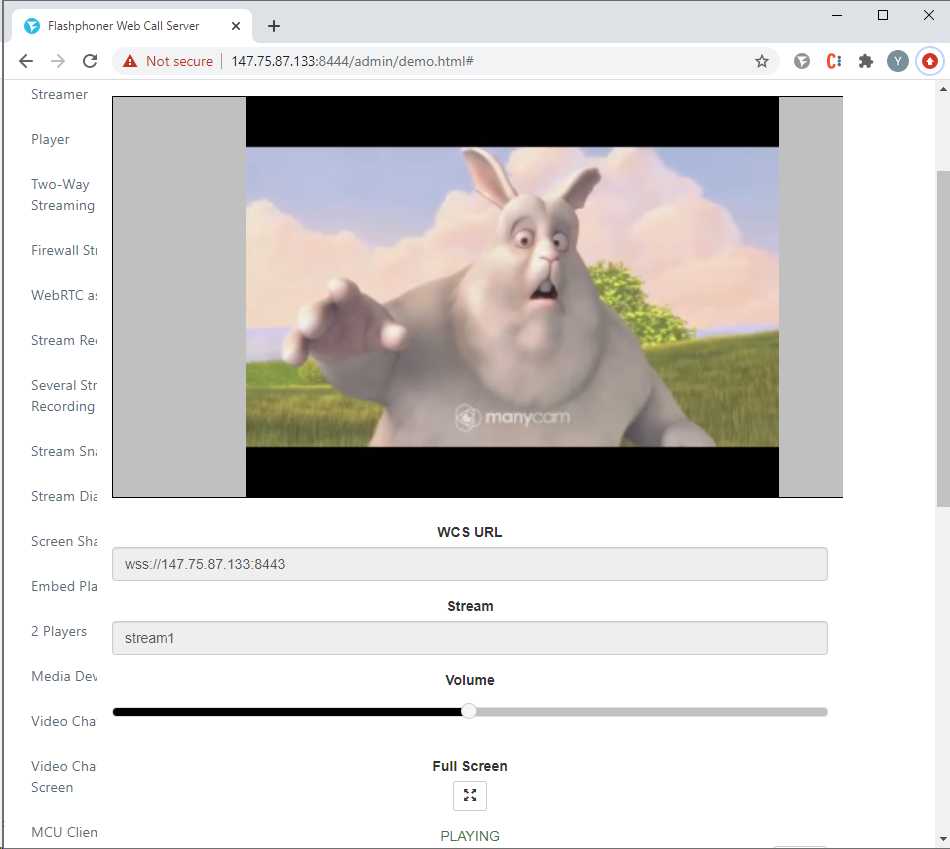
The testing done for high-end servers was a success. We managed to connect 1001 viewers and the broadcast’s quality was decent.
Test three – powerful servers, loaded streams
In the previous two tests we used a low-resolution stream (240p) as our source. Experience shows, however, that these days such streams are hardly in demand. Videos that are fullHD and beyond are much more compelling. So, let us test whether our “big” servers can handle streams in 720p.
To publish the stream we will need to follow this example “Media Devices“, which shows how to publish streams with specified parameters:
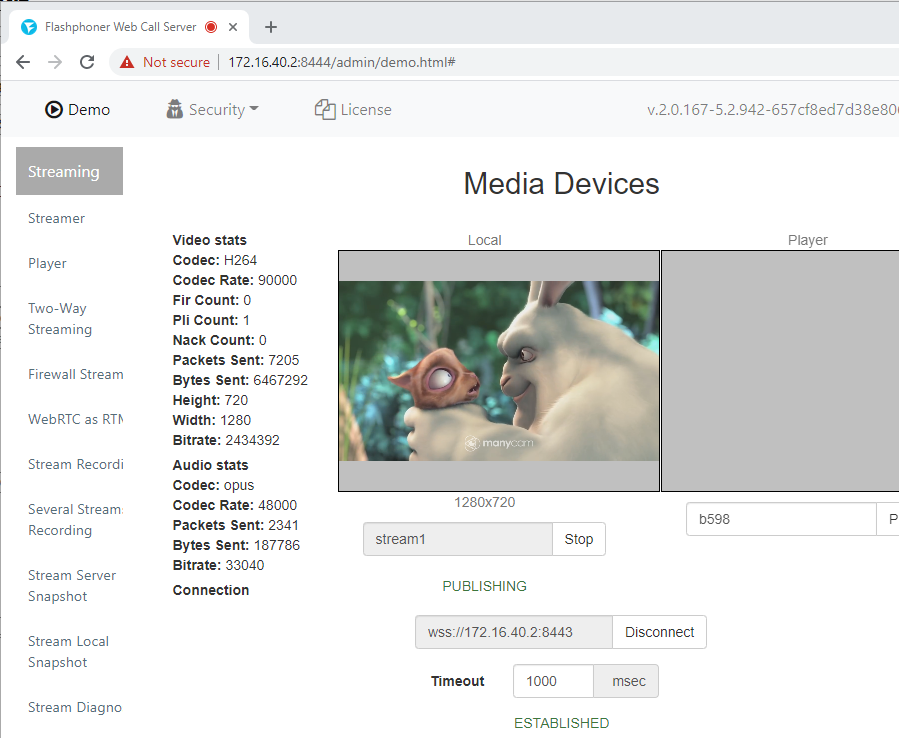
As before, we will use the Console web app to initiate the test. The results will be assessed using graphs from Grafana and a control playback of the published stream.
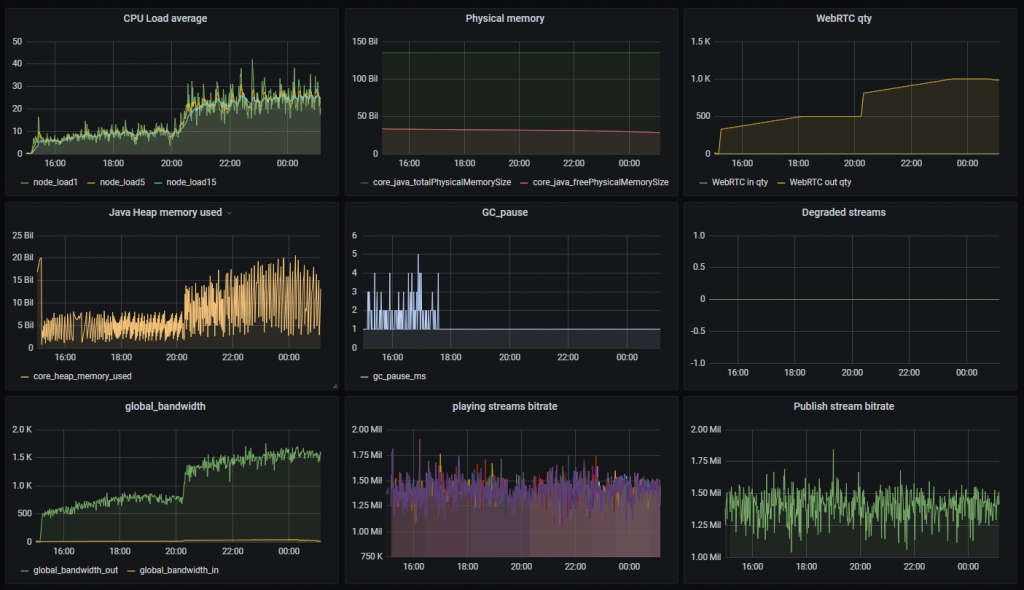
In our first test, it took 8 hours before 1000 users were able to connect, even though the graphs show that the server load was not substantial:
This has to do with the capabilities of the server that captures streams and simulates subscribers. In a test like this, the test server comes under a heavy load, and, evidently, our server couldn’t handle it. To verify this theory, let’s add another test server into the mix in order to split the number of subscribers—and the loads they create—into groups of 500 (500 streams for each server):
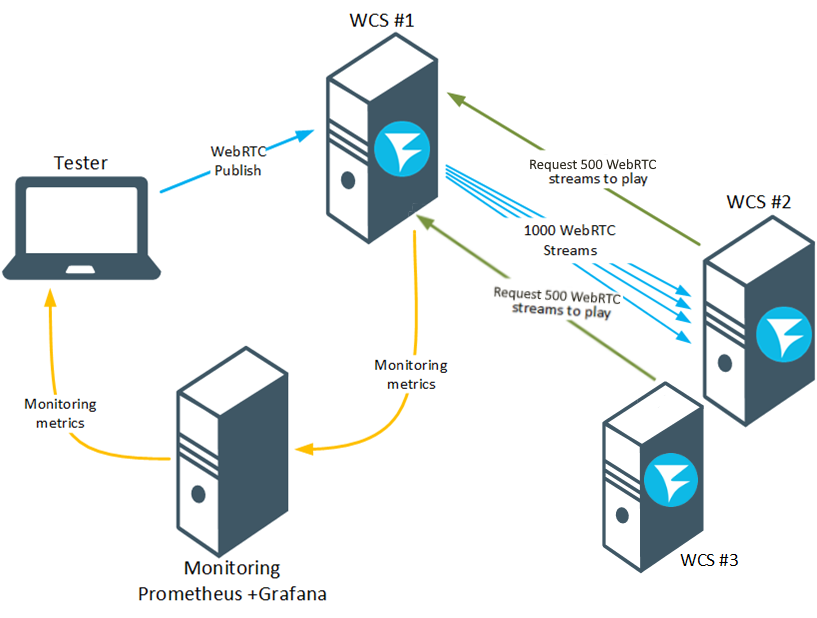
We initiate the test just as shown in the previous examples.
This time it initiated much faster. Within 10 minutes the server had 1000 subscribers:
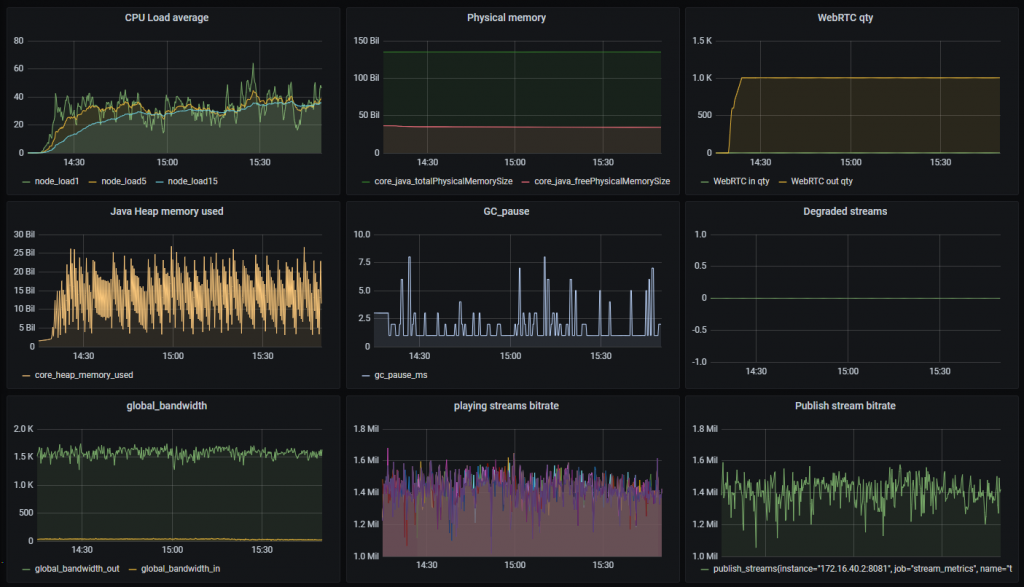
The graphs show the test was a success: the Load Average 1 was around 40. The singular spike to 60 didn’t result in performance degradation. ZGC pauses did not exceed 8 ms. No degraded streams were registered. Playback of the published stream also went smoothly: with no freezes, artifacts, or audio issues.
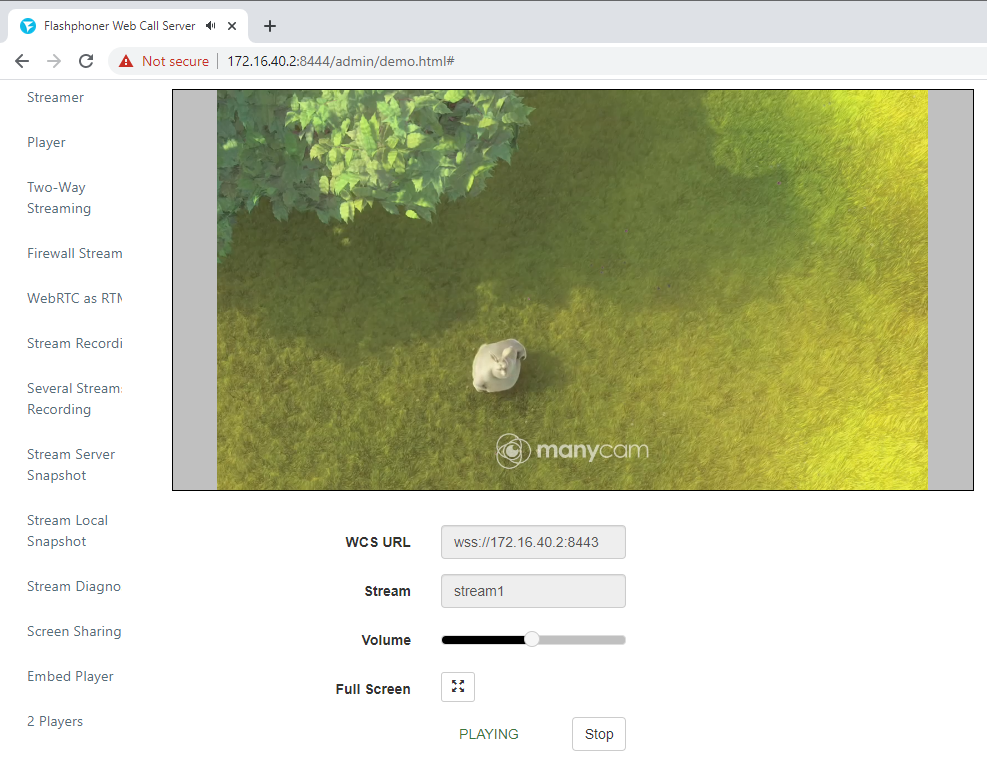
It appears that for a successful test the server that handles stream capturing must be as least twice as powerful as the server being tested. Alternatively, you can use several less powerful servers to achieve the same result.
The test results might vary depending on the environment, and the location of servers and users (both subscribers and streamers).
In this article, we’ve taken a look at one of the stress test variants. The data from the such tests can be used to optimize the server configuration and fit it to your specific needs, to avoid under- and over-loading the equipment.
Good streaming to you!


