Frequent requests to our support include questions about organizing monitoring for WebRTC streaming. As a rule, it is important for a streamer to know what is happening on the “other side” – i.e. to assess the stream quality, the number of viewers and other parameters. The quality of the stream, as has already been discussed many times, is not constant and depends on many factors, such as the load on the server with or without transcoding, and the use of TCP or UDP transport protocols, and the presence of packet loss and/or NACK feedbacks, etc. All these data for assessing stream quality can be obtained manually from various sources.
Stream degradation is a condition of a video/audio stream, in which the picture and sound quality is not satisfactory. There are artifacts, friezes, stuttering, or out of sync sound.

10 Important Metrics
1. CPU
If the processor is loaded by more than 80%, and/or the CPU load periodically rises to 100%, this means that the server is overloaded and does not have enough processing power to perform work operations, which will certainly lead to degradation of streams.
You can estimate the current processor load using the htop software. Or top. Or mpstat. The screenshot below shows htop:

Usually, the Load average parameter is estimated – the average value of the system load. This parameter is displayed as three values, which represent the average load data for the last 1, 5 and 15 minutes. The lower the value, the better.
load average: 4.55 4.22 4.18
For example, such values for a quad-core processor mean that it works at the limit of its capabilities for a long time (several hours), and such work will definitely lead to degradation of streams.
2. Degraded streams percentage
The next metric, which is directly related to the previous one: degraded_streams_percent – the percentage of degraded streams. A stream is degraded if the server does not have time to process the queue of this stream.
The server is multithreading. The video data of the published stream is queued, and the data is sent in a separate thread. In case of a high load on the CPU and a lack of performance for encoding/decoding or with internal locks, these queues can grow, and streams can degrade. Therefore, the percentage of degraded streams is an important metric that signals a loss of quality.
You can find the value of degraded_streams_percent on the statistics page http://demo.flashphoner.com:8081/?action=stat (where demo.flashphoner.com is the address of the WCS server)

The following few metrics are relevant to the Java Virtual Machine:
3. Java GC pause
Garbage collection pause time. Like in the case of the Load average, the lower the number, the better. 100 ms is very bad. The situation when a Java machine starts the garbage collector is called “Stop the world,” which means that your application will be completely stopped while the garbage collection is running. All server threads will be stopped for a moment, and this is enough to degrade the streams.
4. Java Heap
The size of Java Heap memory used. If it approaches -Xmx and remains constantly at these values, this means the constant work of the garbage collector, and as a result, high CPU consumption, possible degradation of streams, as well as an increase in the likelihood of the “OutOfMemoryError” error, which is a signal of an irreversible violation of the internal state server. If such an error occurs at least once, the server is already broken, so it is recommended to restart it.
When an OutOfMemoryError appears, the Java machine can stop any thread, thereby disrupting server operation, although externally the server will continue to work and service connections.
5. Physical memory
The -Xmx limit for heap does not guarantee a limit on RES physical memory usage. If the heap was given 16 GB, RES can take 32 GB or more, and this is not always a memory leak.
Especially in heavy mixing and transcoding scenarios. Therefore, the “real memory” must be monitored and not be exhausted, since this will terminate the server process by the system itself.
These metrics can be tracked using the Java Mission Control tool. Java Mission Control is a powerful tool for monitoring and debugging a Java machine that comes with the JDK and runs on the user’s (administrator’s) PC.

6. Transcoder queues and transcoding time
Transcoding is a separate scenario with a high load on server resources. In paragraph 2, we already wrote about Degraded streams. Now, this is a later metric. In the case of transcoders, first the metrics of the queues of transcoders will show the excess and only then the Degraded streams will react. Transcoder queue metrics show the number of frames accumulated in the decode/encoding queue. Frames are heavy, and 30 accumulated frames means 1 second of latency with a frame rate of 30 FPS.
The decoding/encoding time tells us how quickly the corresponding operations go. For example, at 30 FPS, the encoding operation for one frame should take no more than 1/30 second = 33 milliseconds. Otherwise, the transcoder will not be able to deliver frames on time, which will ruin the stream.
Decoding/encoding queue metrics:
transcoding_video_decoding_max_queue_size
transcoding_video_encoding_max_queue_size
Maximum decoding/encoding time metrics
transcoding_video_decoding_max_time
transcoding_video_encoding_max_time
These metrics are available on the statistics page:

7. Number of free ports for streaming
Metric: ports_media_free
An important metric for highly loaded servers.
Ports are allocated for each stream. If the ports in the range run out, adding new streams on the server will cause an error.
Information on the number of ports can be found on the statistics page:

8. Stream audio and video synchronization
Metric: streams_synchronization
An important metric, which is also called lipsync (synchronization of lips and voice in video broadcasts). Out of sync can be caused by a variety of reasons, ranging from poor quality stream source to server performance issues.
With an out of sync of 100 milliseconds or more, the human ear and eye will already notice that something is wrong. The metric allows you to see this moment in numbers, in milliseconds for each stream; a positive value of the metric shows that audio is playing ahead of the video, and a negative value indicates that audio is lagging behind the video.
The screenshot below shows normal synchronization of audio and video in streams. The metric shows values from +2 to +79 milliseconds.

9. Number of open transcoders
Transcoders, namely encoders, have the maximum impact on server load. Therefore, it is important to control their number.
If your script does not involve the use of transcoding (for example, streaming without changing the resolution), then the number of decoders and encoders should be zero.
Metrics:
native_resources.video_decoders
native_resources.video_encoders
In the screenshot below, transcoding is not used.

10. Total load on transcoders
The number of transcoders is a good metric, but the two encoders can differ by an order of magnitude in terms of CPU utilization.
For example, stream encoding 240p 15 FPS and 1080p 60 FPS. Therefore, to get an idea of the loading, it is important to consider not only the number of encoders, but their weight.
The encoder weight is: w x h x FPS, where w and h is the image resolution. As a result, the metric allows to display the real load of the server by encoders, and one heavyweight encoder can show a higher load than 10 lightweight ones.
Metrics:
transcoding_video_decoding_load
transcoding_video_encoding_load

You will agree that the set of metrics on the statistics page is quite extensive, so it is not very convenient to click all this in real time. Especially if you have an active stream in parallel.
Therefore, various monitoring systems have long been invented. They collect all statistical information and show it to interested parties in a convenient form. In addition to observing the parameters, the monitoring system can help in the timely detection and elimination of any malfunctions during the broadcast.
So, you have already understood that the monitoring system is an absolute must-have, it remains only to choose a specific “model.” Today there is a huge variety of monitoring systems for every taste, color and wallet. Let’s get acquainted with a relatively young open source monitoring system, Prometheus.
Prometheus is an open source (Apache 2.0) time series DBMS written in the Go language. It just stores your metrics. An interesting feature of Prometheus is that it collects metrics from a given set of services (performs pulling). Prometheus consists of separate components that communicate with each other via http and is configured in yaml-configs. This is not a plug & play solution. Prometheus is a set of tools that allows you to set up yourself the kind of monitoring you need. In our article, we will discuss how to set up monitoring of WCS server and WebRTC streams in Prometheus.
Preparing for installation
If your system uses a firewall, you need to open ports
- TCP 9090 — http for Prometheus server;
- TCP 9093 — http for alert manager;
- TCP and UDP 9094 — for alert manager;
- TCP 9100 — for node_exporter;
- TCP 3000 — http for Grafana server.
For example, using iptables:
iptables -I INPUT 1 -p tcp --match multiport --dports 9090,9093,9094,9100 -j ACCEPT
iptables -A INPUT -p udp --dport 9094 -j ACCEPT
If you are using a Red Hat-based operating system, SELinux will probably be enabled by default. You can disable it using the commands
sudo setenforce 0
sudo sed -i 's/^SELINUX=.*/SELINUX=disabled/g' /etc/selinux/config
We are now ready to install Prometheus and Grafana.
Installing and configuring Prometheus monitoring
Prometheus does not have its own repositories for popular distributions, and the official operating system repositories tend to lag behind the upstream. Therefore, we will look at the manual installation. This method is suitable for any Linux distributions running on systemd (Ubuntu, Debian, Centos, Arch, etc.). You will need to download the source, create a user, manually copy the necessary files, assign rights, and create a unit for autorun.
You can download the source from the official download page. Copy the link to the Linux package and download it using wget:
wget https://github.com/prometheus/prometheus/releases/download/v2.21.0/prometheus-2.21.0.linux-amd64.tar.gz
Create directories to copy the files for Prometheus:
mkdir /etc/prometheus
mkdir /var/lib/prometheus
Unpack the downloaded archive:
tar zxvf prometheus-*.linux-amd64.tar.gz
Go to the directory with the unpacked files:
cd prometheus-*.linux-amd64
Distribute files into directories:
cp prometheus promtool /usr/local/bin/
cp -r console_libraries consoles prometheus.yml /etc/prometheus
Create a user that will start the monitoring system:
sudo useradd --no-create-home --shell /bin/false prometheus
Set the owner for the directories that we created in the previous step:
sudo chown -R prometheus:prometheus /etc/prometheus /var/lib/prometheus
Set the owner for the copied files:
sudo chown prometheus:prometheus /usr/local/bin/{prometheus,promtool}
Configure Prometheus autorun:
Create a prometheus.service file:
sudo nano /etc/systemd/system/prometheus.service
Place the following text in it:
[Unit]
Description=Prometheus Service
After=network.target

[Service]
User=prometheus
Group=prometheus
Type=simple
ExecStart=/usr/local/bin/prometheus \
--config.file /etc/prometheus/prometheus.yml \
--storage.tsdb.path /var/lib/prometheus/ \
--web.console.templates=/etc/prometheus/consoles \
--web.console.libraries=/etc/prometheus/console_libraries
ExecReload=/bin/kill -HUP $MAINPID
Restart=on-failure

[Install]
WantedBy=multi-user.target
Re-read the systemd configuration:
sudo systemctl daemon-reload
Allow autorun:
sudo systemctl enable prometheus
After creating autorun, start Prometheus as a service:
sudo systemctl start prometheus
In the browser, open http://<IP-адрес сервера>:9090, and if everything is done correctly, we get to the Prometheus monitoring system console. So far, it is useless, but you can already press and see the menus.

So, let’s connect WCS to monitoring. Open the prometheus.yml settings file for editing
sudo nano /etc/prometheus/prometheus.yml
Add a description of the monitoring configuration to the file:
scrape_configs:
  - job_name: 'flashphoner'
    metrics_path: '/'
    params:
      action: [stat]
      format: [prometheus]
    static_configs:
      - targets: ['WCS_address:8081']
where:
- WCS_address – WCS server address;
- 8081 – WCS server port for displaying statistics.

After changing the settings of prometheus.yml, restart the service:
sudo systemctl restart prometheus
Return to the Prometheus console, select the “Status => Targets” menu item:

Make sure that Prometheus receives data from WCS (the target is in the “UP” state):

This concludes the monitoring setup. Let’s move on to setting up charts.
Installing and configuring Grafana
Grafana is a web interface for various time series DBMSs such as Graphite, InfluxDB and Prometheus. In general, Grafana can draw beautiful graphs using information from Prometheus. Earlier we saw that Prometheus also had its own web interface, but it was extremely minimalistic and rather inconvenient. Therefore, even the Prometheus developers themselves recommend using Grafana. Well, who are we to argue with the developers?
Let’s get started.
Grafana as well as Prometheus will be installed manually using the deb package. Find a link to a fresh package and download it using wget at https://grafana.com/grafana/download:
wget https://dl.grafana.com/oss/release/grafana_7.2.1_amd64.deb
Unpack it:
sudo dpkg -i grafana_7.2.1_amd64.deb
Allow autorun:
sudo systemctl enable grafana-server
Run it:
sudo systemctl start grafana-server
Open the web interface at http://<IP-адрес сервера>:3000. Default login and password: admin/admin. When you first log in, Grafana will immediately prompt you to change your password.
Change the password and add Prometheus as a data source:
Click the “Add data source” button:

and select Prometheus:

Specify the parameters for the connection. It is enough to specify the address and port of the Prometheus Web interface. Press the Save & Test button to save:

After successful connection, create a new panel for charts. Choose from the menu on the left side of the Create – Dashboard window:

Click the “Add new panel” button:

On the “Query” tab, select the previously created Prometheus (1) as a data source and select the metrics we are interested in from the list (2):

Then you can go through the rest of the points by selecting specific parameters and the type of chart. After that, save the panel setting (3).
Set the dashboard name and save:

In the screenshot above, the graph displays all available metrics for stream_stats.
You can make a graph for a specific metric that interests you. To do this, you need to specify its name in the “Metrics” field. For example, in the screenshot below, we selected the “Number of incoming RTSP streams” metric:

Now let’s create graphs for the key metrics that we discussed at the beginning of this article.
Metric selection lines:
Degraded streams percentage:
degraded_streams_stats{instance="demo.flashphoner.com:8081", job="flashphoner", param="degraded_streams"}
degraded_streams_stats{instance="demo.flashphoner.com:8081", job="flashphoner", param="degraded_streams_percent"}
Java heap:
core_stats{instance="demo.flashphoner.com:8081", job="flashphoner", param="core_heap_memory_used"}
Physical memory usage for Java:
core_stats{instance="demo.flashphoner.com:8081", job="flashphoner", param="core_java_freePhysicalMemorySize"}
core_stats{instance="demo.flashphoner.com:8081", job="flashphoner", param="core_java_totalPhysicalMemorySize"}
Transcoder queues and transcoding time:
transcoding_stats{instance="demo.flashphoner.com:8081", job="flashphoner", param="transcoding_video_decoding_max_queue_size"}
transcoding_stats{instance="demo.flashphoner.com:8081", job="flashphoner", param="transcoding_video_encoding_max_queue_size"}
transcoding_stats{instance="demo.flashphoner.com:8081", job="flashphoner", param="transcoding_video_decoding_max_time"}
transcoding_stats{instance="demo.flashphoner.com:8081", job="flashphoner", param="transcoding_video_encoding_max_time"}
Number of free ports for streaming:
port_stats{instance="demo.flashphoner.com:8081", job="flashphoner", param="ports_media_free"}
Audio and video synchronization in streams:
streams_stats{instance="demo.flashphoner.com:8081", job="flashphoner", name="s1", param="streams_synchronization"}
Number of open transcoders:
native_resources{instance="demo.flashphoner.com:8081", job="flashphoner", param="native_resources.video_decoders"}
native_resources{instance="demo.flashphoner.com:8081", job="flashphoner", param="native_resources.video_encoders"}
Total load on transcoders:
transcoding_stats{instance="demo.flashphoner.com:8081", job="flashphoner", param="transcoding_video_encoding_load"}
transcoding_stats{instance="demo.flashphoner.com:8081", job="flashphoner", param="transcoding_video_decoding_load"}
Dashboard view with charts:

Unfortunately, so far we have not received all the metrics we are interested in. There are 10 metrics, and only 8 charts were built. Let’s find the missing charts – CPU and Java GC pause.
Operating system metrics
To get metrics from the operating system in which WCS is deployed, install and configure node_exporter. Since in our case, the WCS server and the Prometeus server are different machines, it is necessary to open tcp port 9100 on the WCS server.
For example, like this:
bash
sudo firewall-cmd --zone=public --add-port=9100/tcp --permanent
The further installation process is the same as for Prometheus.
Download node_exporter from the official page at the link
wget https://github.com/prometheus/node_exporter/releases/download/v1.0.1/node_exporter-1.0.1.linux-amd64.tar.gz
Unpack the downloaded archive:
tar zxvf node_exporter-*.linux-amd64.tar.gz
And go to the directory with the unpacked files:
cd node_exporter-*.linux-amd64
Copy the executable file to bin:
cp node_exporter /usr/local/bin/
Create user nodeusr:
sudo useradd --no-create-home --shell /bin/false nodeusr
We set the owner for the executable file:
sudo chown -R nodeusr:nodeusr /usr/local/bin/node_exporter
To configure autorun in systemd, create a node_exporter.service file:
nano /etc/systemd/system/node_exporter.service
Place the following text in it:
[Unit]
Description=Node Exporter Service
After=network.target

[Service]
User=nodeusr
Group=nodeusr
Type=simple
ExecStart=/usr/local/bin/node_exporter
ExecReload=/bin/kill -HUP $MAINPID
Restart=on-failure

[Install]
WantedBy=multi-user.target
Re-read the systemd configuration:
sudo systemctl daemon-reload
Allow autorun:
sudo systemctl enable node_exporter
Run the service:
sudo systemctl start node_exporter
Open a web browser and go to http://<IP address of the WCS server>:9100/metrics — we will see the metrics collected by node_exporter:

Now let’s connect node_exporter on WCS to Prometheus server.
On the Prometheus server, open the prometheus.yml configuration file for editing:
sudo nano /etc/prometheus/prometheus.yml
and add a new task to collect data from node_exporter to WCS. Be careful with the indentation in the yml file:
 - job_name: 'WCS_node_exporter'
    scrape_interval: 5s
    static_configs:
    - targets: ['demo.flashphoner.com:9100']

After changing the settings file prometheus.yml, restart the service:
sudo systemctl restart prometheus
Go to Grafana and add a graph for CPU load to the previously created dashboard:

CPU metrics:
node_load1
node_load5
node_load15
Collecting statistics using external scripts
WCS provides the ability to collect statistics using an external script.
To enable this function, you need to specify the path to the script file for collecting statistics in the “flashphoner.properties” file, for example, for the custom_stats.sh file located in the /usr/local/FlashphonerWebCallServer/bin directory, it can be written as follows:
custom_stats_script=custom_stats.sh
If you have a different path to the script file, then you need to specify it in full:
custom_stats_script=/path/to/custom_stats.sh
Let’s write a script that collects pause data for the Java garbage collector
#!/bin/bash

WCS_HOME="/usr/local/FlashphonerWebCallServer"
LAST_LOG=$(ls -t ${WCS_HOME}/logs/ | grep gc-core | head -1)
LOG="${WCS_HOME}/logs/${LAST_LOG}"
JAVA_VER=$(java -version 2>&1 | head -n 1 | awk -F '"' '{print $2}')

TYPE_GC="$(grep -Pv '^(#|$)' ${WCS_HOME}/conf/wcs-core.properties | grep -oE 'ConcMarkSweepGC|ZGC')"

#GC
if [[ $JAVA_VER != "1"[0-9]* ]]; then
        gc_pause=$(grep 'Allocation Failure' $LOG | tail -1 | awk -F'->' '{print $3}' | sed -rn 's/([0-9]+)K\(([0-9]+)K\), ([0-9]+.[0-9]+).*/\3/p' | tr , . | awk '{printf "%f\n", $1 * 1000 }')
		echo "gc_pause=$gc_pause"
#ZGC
elif [[ $JAVA_VER == "1"[0-9]* ]]; then
    if [[ $TYPE_GC == "ConcMarkSweepGC" ]]; then
        gc_pause=$(grep 'Allocation Failure' $LOG | tail -1 | awk '{print $8}' | sed 's/ms$//')
		echo "gc_pause=$gc_pause"
    fi
    if [[ $TYPE_GC == "ZGC" ]]; then
        gc_pause=$(grep '.*GC.*Pause' $LOG | awk -F 'Pause Mark Start|End|Relocate Start' '{print $2}' | tail -3 | sed 's/ms$//' | awk '{a=$1; getline;b=$1;getline;c=$1;getline;t=a+b+c;print t}')
		echo "gc_pause=$gc_pause"
    fi
fi
This script requests for Java version installed in the system and, according to this information, finds lines with data on pauses for garbage collection for GC or ZGC in the log and outputs this value (in milliseconds) to the “gc_pause” parameter.
The statistics that we have collected using an external script are displayed on the statistics page http://demo.flashphoner.com:8081/?action=stat in the “Custom info” section:

The previously configured monitoring system Prometheus takes it from there.
Now let’s add a graph for this metric to the dashboard in Grafana:

Metric for Java GC pause:
custom_stats{instance="demo.flashphoner.com:8081", job="flashphoner", param="gc_pause"}
General view of a dashboard with graphs for monitoring WCS performance metrics

We have collected and built graphs for server performance metrics. Now let’s look at how you can build graphs for the parameters of a specific stream that will be published on the server.
Collecting metrics for streams
If you execute a REST request
/stream/metrics
the result will be a fairly extensive list of metrics. And, if everything is clear from the metrics like “VIDEO_HEIGHT,” “VIDEO_WIDTH,” “VIDEO_CODEC” and “AUDIO_CODEC,” then I propose to get acquainted with other metrics in more detail
The metrics “AUDIO_SYNC” and “VIDEO_SYNC” are familiar metrics for audio and video synchronization in published streams.
The metric “VIDEO_K_FRAMES” — Кthe number of the video’s key frames (I-frames). A key frame contains all information about the image in the frame and does not depend on other frames. Keyframes have the lowest compression ratio. If the browser does not send keyframes evenly, this can lead to freezes when playing the stream. The following is closely related to this metric:
The metric “VIDEO_PLI” — the number of PLI requests for keyframes from the browser. PLI can be sent when the stream receiver has lost a full frame or multiple frames. A large number of PLI requests indicates a bad channel.
The metrics “VIDEO_P_FRAMES” and “VIDEO_B_FRAMES” — the number of P-frames (intermediate or tween) and B-frames (bidirectional), respectively. A tween can refer to blocks of an image in a previous key or previous tweens. This allows you to make intermediate frames smaller than the key ones: they contain less information about the image. A bi-directional frame does not contain the entire image either. But unlike a tween, it can also refer to subsequent blocks, up to the next tween – hence its name. Bidirectional frames take up even less space than intermediate frames. The method of decoding a bidirectional frame is even more complicated than decoding an intermediate frame: first, the next frame after the bidirectional intermediate frame is decoded according to the scheme described above; the bidirectional frame is then decoded using the information about neighboring frames.
It turns out that the more often B frames appear in a stream, the more resources are required to decode this stream, which can negatively affect the video quality. Moreover, browsers cannot play B-frames correctly, and if there are bidirectional frames, the image will twitch.
The metrics “AUDIO_RATE” and “VIDEO_RATE” show the bitrate of audio or video.
The metric “VIDEO_FPS” refers to video frame rate.
Three more metrics related to packet loss on communication channels:
“VIDEO_NACK” — the number of NACK requests. NACK — it is a way for the receiving party to indicate that it has not received a particular packet or list of packets.
“VIDEO_LOST” — the number of video packets lost.
“AUDIO_LOST” — the number of audio packets lost.
A large number of NACK requests and lost packets also mean problems with communication channels. This is manifested by freezing in the stream, loss of sound and other unpleasant stuff.
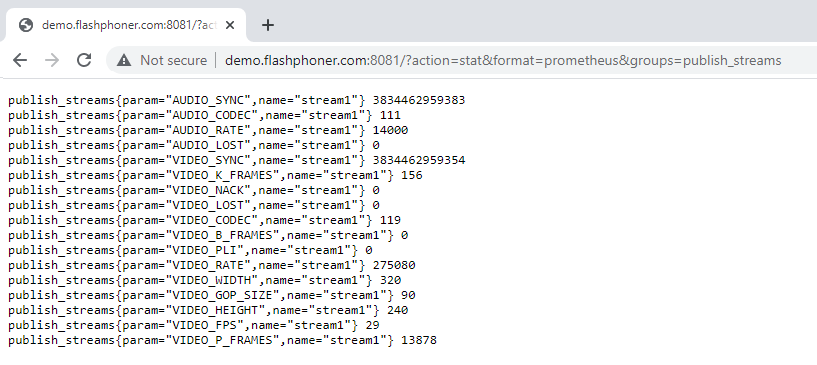
The above metrics for published streams are also available in the web interface on the statistics page:
http://demo.flashphoner.com:8081/?action=stat&format=prometheus
Metrics are displayed on the statistics page if there is at least one published stream on the server. Now let’s connect them to collection in Prometheus. To do this, in the settings file prometheus.yml
sudo nano /etc/prometheus/prometheus.yml
add a new task to collect data on metrics for a stream. In this case, Prometheus will collect metrics from the statistics page. Be careful with the indentation in the yml file:
 - job_name: 'stream_metrics'
    metrics_path: '/'
    params:
      action: [stat]
      format: [prometheus]
      groups: [publish_streams]
    static_configs:
    - targets: ['demo.flashphoner.com:8081']

Save the configuration and restart Prometheus:
sudo systemctl restart prometheus
Moving on to Grafana. I propose to create a new panel for stream metric charts. Select Create – Dashboard from the menu on the left side of the window

Click the “Add new panel” button

On the “Query” tab, select Prometheus as a data source and select publish => publish_streams from the list of metrics:

As a result, we get graphs for all available metrics for each published stream. For clarity, you can display the metrics of interest on a separate graph. For example, a list of metrics for a stream published on demo.flashphoner.com named “stream1”
publish_streams{instance="demo.flashphoner.com:8081", job="stream_metrics", name="stream1", param="AUDIO_CODEC"}
publish_streams{instance="demo.flashphoner.com:8081", job="stream_metrics", name="stream1", param="AUDIO_LOST"}
publish_streams{instance="demo.flashphoner.com:8081", job="stream_metrics", name="stream1", param="AUDIO_RATE"}
publish_streams{instance="demo.flashphoner.com:8081", job="stream_metrics", name="stream1", param="AUDIO_SYNC"}
publish_streams{instance="demo.flashphoner.com:8081", job="stream_metrics", name="stream1", param="VIDEO_B_FRAMES"}
publish_streams{instance="demo.flashphoner.com:8081", job="stream_metrics", name="stream1", param="VIDEO_CODEC"}
publish_streams{instance="demo.flashphoner.com:8081", job="stream_metrics", name="stream1", param="VIDEO_FPS"}
publish_streams{instance="demo.flashphoner.com:8081", job="stream_metrics", name="stream1", param="VIDEO_HEIGHT"}
publish_streams{instance="demo.flashphoner.com:8081", job="stream_metrics", name="stream1", param="VIDEO_K_FRAMES"}
publish_streams{instance="demo.flashphoner.com:8081", job="stream_metrics", name="stream1", param="VIDEO_LOST"}
publish_streams{instance="demo.flashphoner.com:8081", job="stream_metrics", name="stream1", param="VIDEO_NACK"}
publish_streams{instance="demo.flashphoner.com:8081", job="stream_metrics", name="stream1", param="VIDEO_PLI"}
publish_streams{instance="demo.flashphoner.com:8081", job="stream_metrics", name="stream1", param="VIDEO_P_FRAMES"}
publish_streams{instance="demo.flashphoner.com:8081", job="stream_metrics", name="stream1", param="VIDEO_RATE"}
publish_streams{instance="demo.flashphoner.com:8081", job="stream_metrics", name="stream1", param="VIDEO_SYNC"}
publish_streams{instance="demo.flashphoner.com:8081", job="stream_metrics", name="stream1", param="VIDEO_WIDTH"}
An example of such a dashboard is below:

As you can see, Prometheus is an interesting and promising tool. Our article cannot claim to be a complete description of this monitoring system, because we have reviewed a special case here, applicable to monitoring WCS and streams. For example, with Prometheus you can also set up alerts, which we did not consider. After reading this article, you now know how Prometheus and Grafana are used, and you can successfully apply them in practice.
Have a nice streaming!