We see video surveillance systems in various places — shops, malls, banks, hotels, office buildings, cottages and apartments, parking lots and busy intersections — it is difficult to name all possible options for installing cameras. There is also a great variety of different hardware and software solutions for organizing video surveillance: analog cameras and hardware video recorders of all kinds and colors, software solutions, cloud solutions, IP cameras that work both offline and with server or software solutions etc. Of all options, we are interested in those that provide video streams via RTSP.
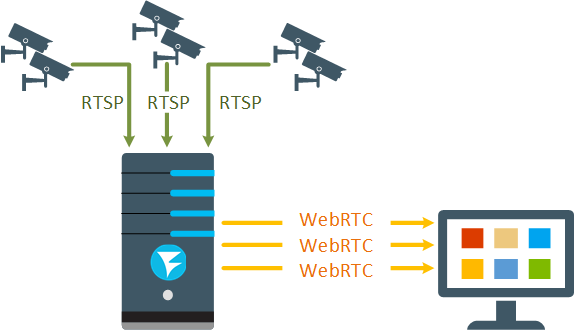
In one of the previous articles, we have already discussed how to add video from an IP camera to your website. For example, a video surveillance system for the entrances of several houses related to one management company. You need to implement the ability to view what is happening in real time on the website of the management company. As you know, browsers cannot play RTSP streams directly you need to turn an RTSP video stream from an IP camera into WebRTC, which is successfully processed by the browser and gives the lowest playback latency — less than 0.5 seconds. This can be done using Web Call Server — server processing streaming video for web projects
And while everything is less or more clear with the software implementation from the article, at the stage of implementing the solution the following question always appears:
“What kind of server do we need and how many cameras can we connect to it?”
This article continues the series of articles on load tests. Today we will analyze the testing methodology and answer the question “How many IP cameras can be connected to WCS?”
Let’s get started.
Testing Plan
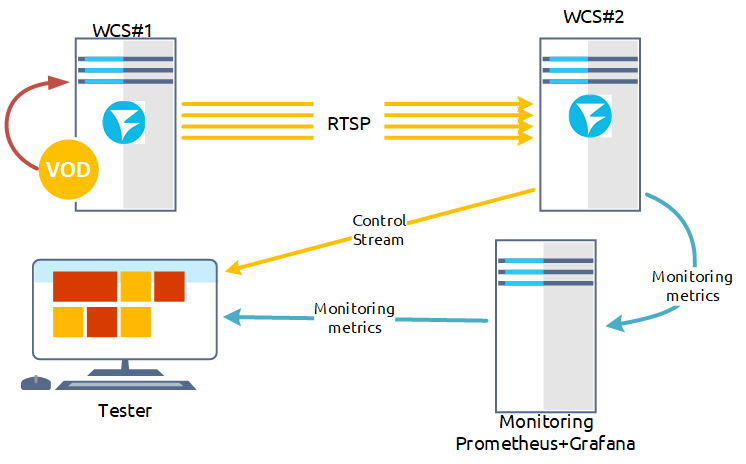
- Publish VOD stream on the WCS#1 server.
- Using a script that uses REST requests, publish RTSP streams on the WCS#2 server.
- Choose a random RTSP stream on WCS#2 and visually evaluate the stream.
- Estimate the load on the WCS#2 server by the metrics values collected by the Prometheus monitoring system for the WCS#2 server.
Testing is considered successful if we can connect 1,000 IP cameras and no degradation of streams is seen in the monitoring results or visually.
Preparing for Testing
For testing, we need
- two WCS servers;
- script for the test;
We assume that you already have WCS servers installed and configured. If not, install them according to this instruction, make tweaks to boost performance and connect to monitoring.
We used two servers for testing:
WCS#1 (testing) with characteristics:
- 24 cores, 48 streams;
- 128 Gb RAM;
- WCS 5.2.958;
- OpenJDK version 14.0.1
and
WCS#2 (tested) with characteristics:
- 12 cores, 24 streams;
- 96 Gb RAM;
- WCS 5.2.958;
- OpenJDK version 14.0.1
Server Settings
File flashphoner.properties (w/o default settings):
#webrtc ports range
media_port_from = 20001
media_port_to = 40000

#websocket ports
ws.port =8080
wss.port =8443

rtsp_activity_timer_timeout=86400000

wcs_agent_port_from=44001
wcs_agent_port_to=55000

global_bandwidth_check_enabled=true
zgc_log_parser_enable=true
zgc_log_time_format=yyyy-MM-dd'T'HH:mm:ss.SSSZ

rtsp_port_from=55001
rtsp_port_to=65000
Here we increased the range of ports for WebRTC, RTSP and WCS agent. We increased the timeout for RTSP streams without subscribers, and also specified settings for collecting additional metrics for network congestion and pauses in ZGC operation.
For the testing server, we added additional settings for VOD — cyclic stream capture and setting the duration of the VOD stream publication after disconnecting subscribers:
vod_live_loop=true
vod_stream_timeout=14400000
File wcs-core.properties (w/o default settings):
-XX:ErrorFile=/usr/local/FlashphonerWebCallServer/logs/error%p.log

# ZGC
-XX:+UnlockExperimentalVMOptions -XX:+UseZGC -Xms24g -Xmx24g -XX:+UseLargePages -XX:ZPath=/hugepages

-Xlog:gc*:/usr/local/FlashphonerWebCallServer/logs/gc-core-:time
Here we changed the settings for naming log files, enabled the use of ZGC, adjusted the Heap size, and enabled the use of memory pages.
Full versions of the configuration files can be downloaded from the Useful Files section at the bottom of the article. There you will also find a panel for Grafana and a script file to start testing.
Test Script
#! /bin/bash
camera=1000

curl -X POST -H 'Content-type: application/json' --data "{\"uri\":\"vod-live://bunny720p-test.mp4\", \"localStreamName\":\"test\"}" "http://localhost:8081/rest-api/vod/startup"
sleep 5s

for i in `seq 1 $camera`; do
curl --data "{\"uri\":\"rtsp://172.16.40.2:554/test?"$i"\",\"toStream\":\"RTSP-test-stream"$i"\"}" -X POST -H 'Content-type: application/json' -s http://172.16.40.3:8081/rest-api/rtsp/startup
sleep 0.1s
done
where:
camera — number of emulated RTSP streams.
We will use 720p video in our tests. More video parameters are shown in the screenshot below:
Testing
On the testing WCS#1 server, run the script for testing:
./RTSP-load-test.sh
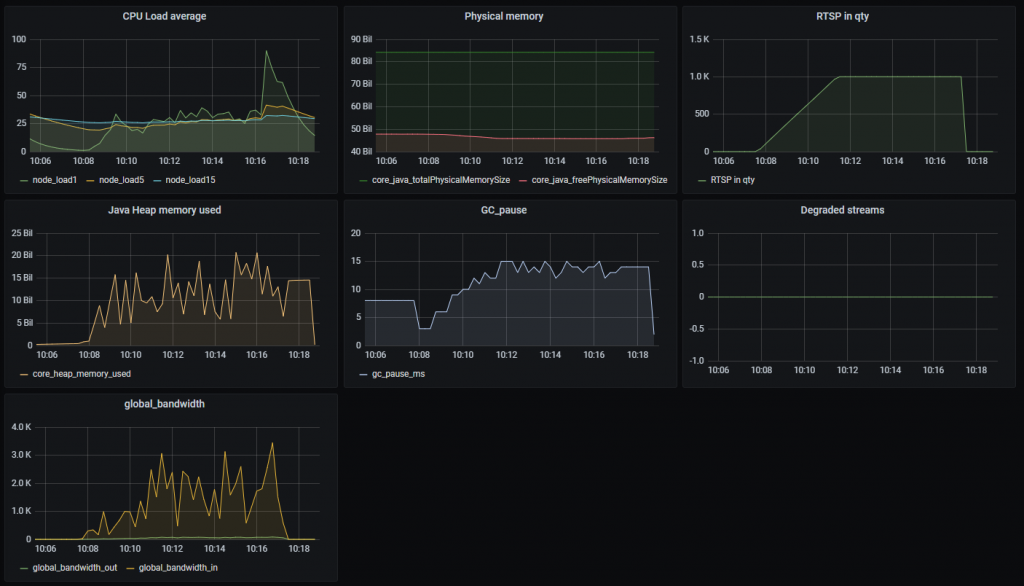
Test result for 1,000 captured RTSP streams:
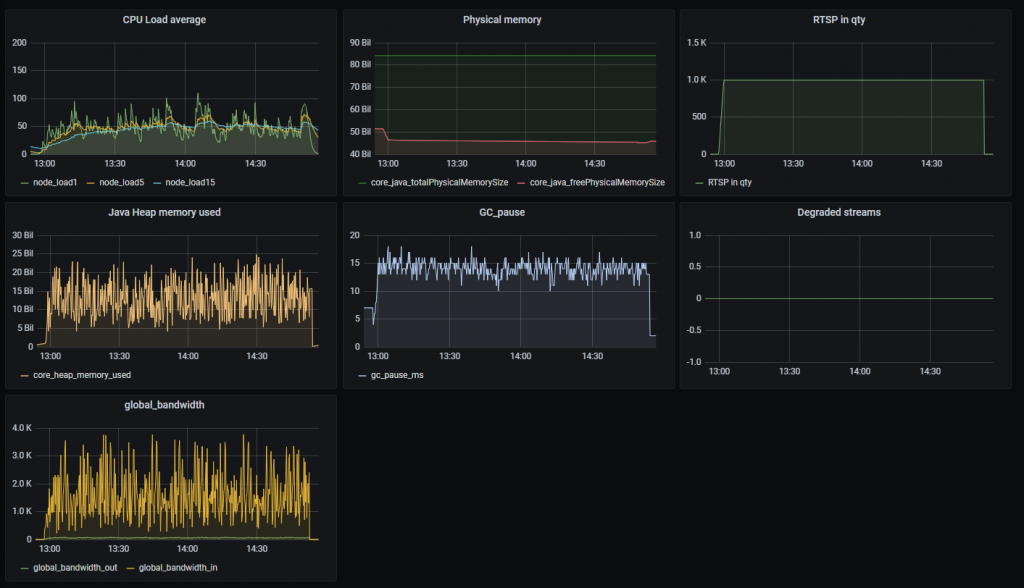
The test was successful. No stream degradation was recorded by metrics. The CPU load according to the Load average 1 metric did not exceed 100 units.
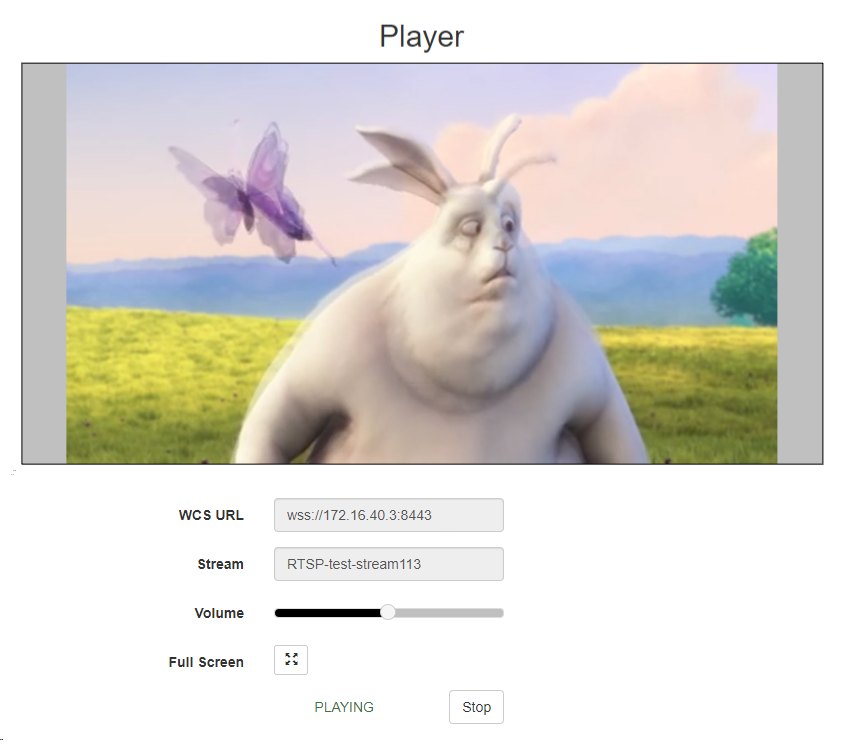
Open the standard example Player on the tested WCS#2 server and start playing a random RTSP stream from the captured ones:
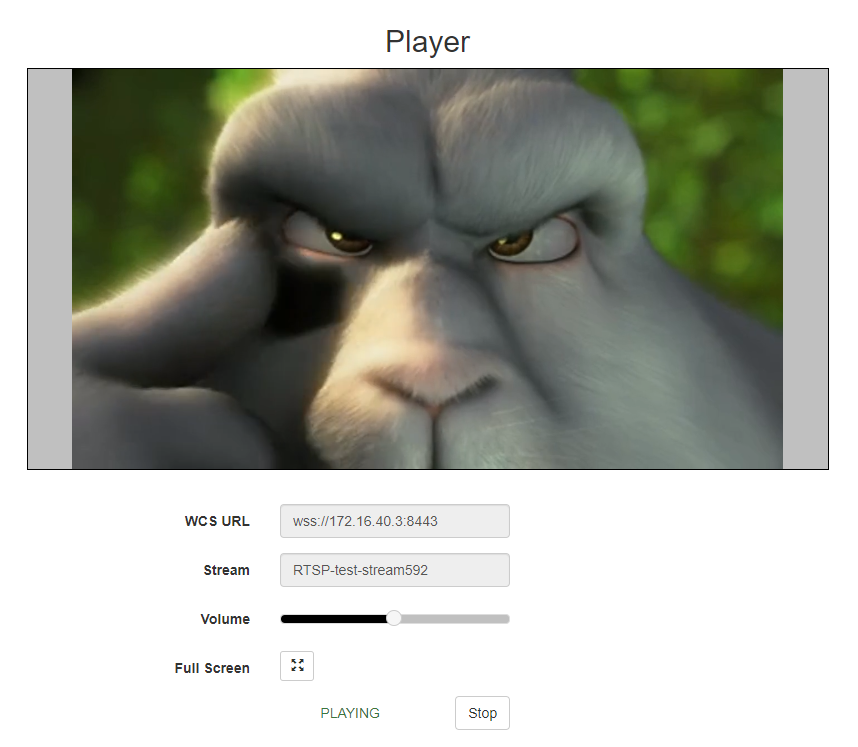
The control stream is played with acceptable quality — no freezing, artifacts and sound quality degradation.
We ran some more tests
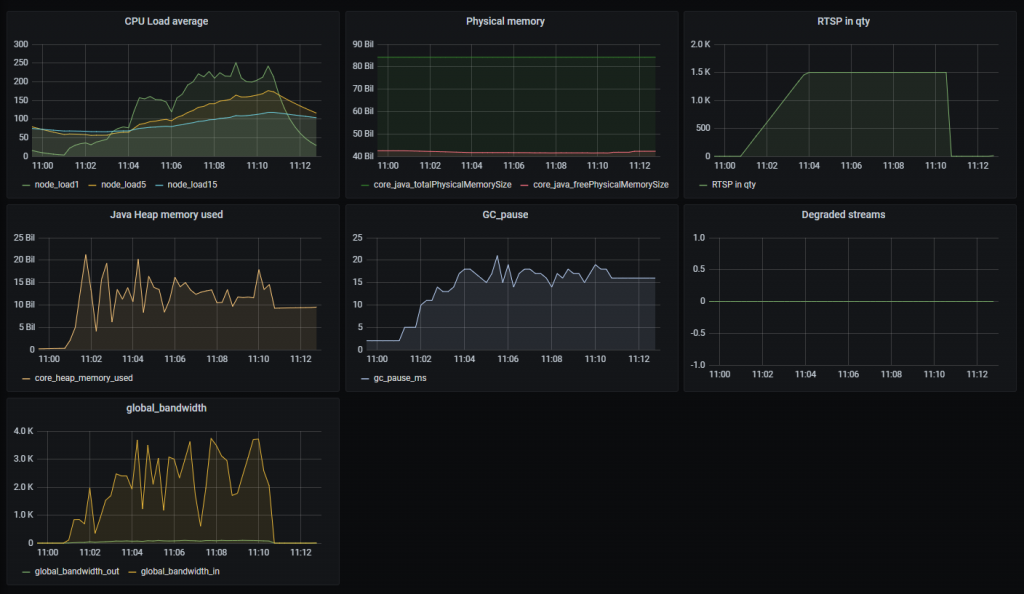
for 1,500 RTSP streams:
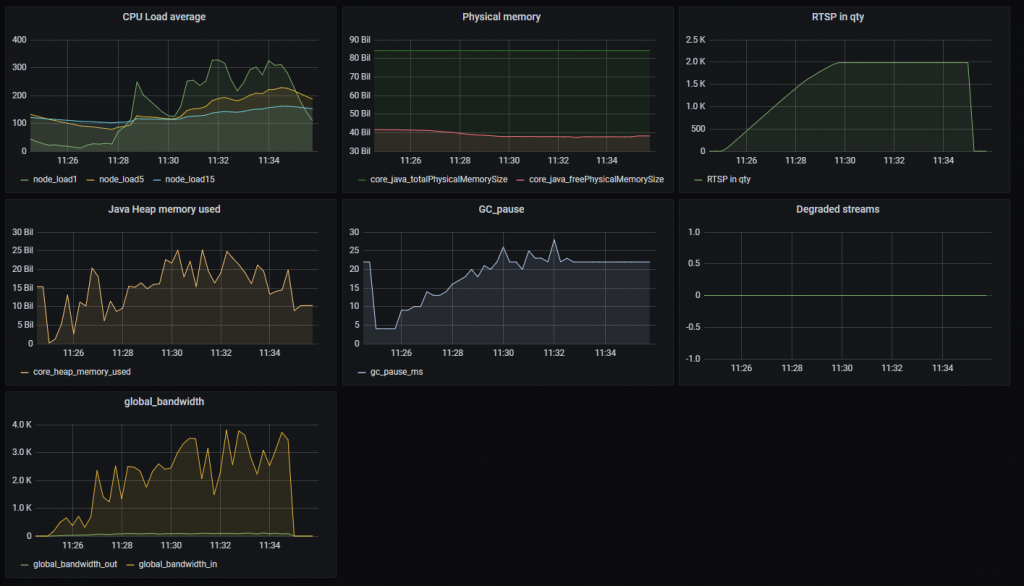
and for 2,000 RTSP streams:
The results of these tests show an increase in the CPU load and an increase in pauses in ZGC. Metrics show no stream degradation, but the control stream is played with noticeable artifacts.
As you can see, the tests were not very long. Therefore, you cannot make a decision on choosing a server for a video surveillance system based solely on these tests. Indeed, in the long term, the behavior of the system can change.
Let’s run another test with 1,000 captured RTSP streams:
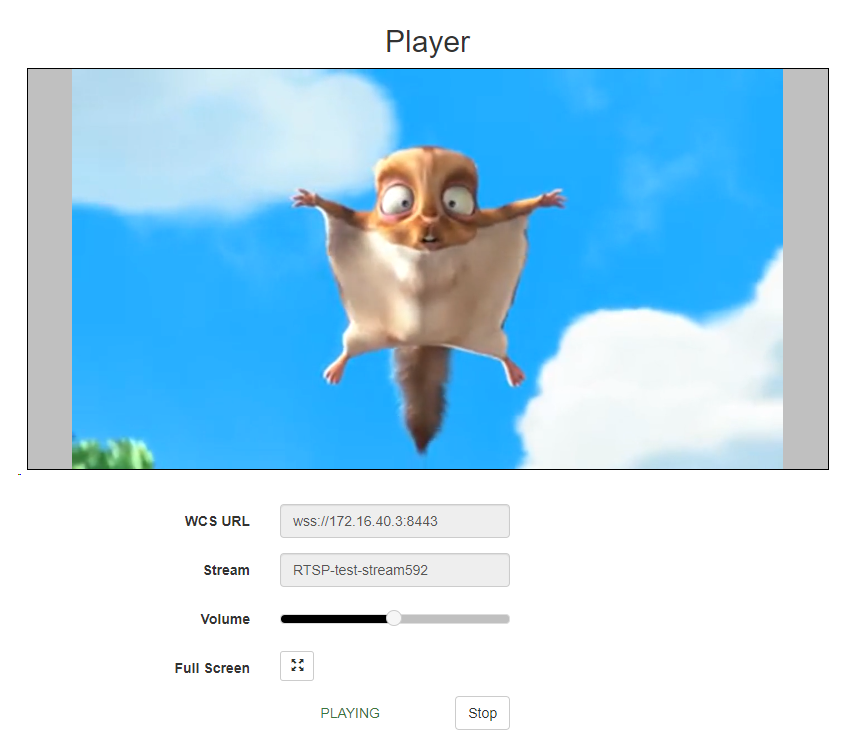
This test lasted nearly two hours. During this time, you can see that there are no critical changes in resource utilization. The control stream was also played correctly all the time:
We remind you that the test results directly depend on the environment, therefore, they may be better or worse when tested on your hardware.
Have a good streaming!
Useful Files
Panel for Grafana:
WCS Settings:
Test Script:

